Today’s date is January 10, 2025, which means it’s time to wrap up one of the hottest topics for farmers: yields! Some exaggerate, others share half-truths, but I’m here to tell it like it is. What gives me the confidence to present my yields as objective?
My calculations are based on the following data:
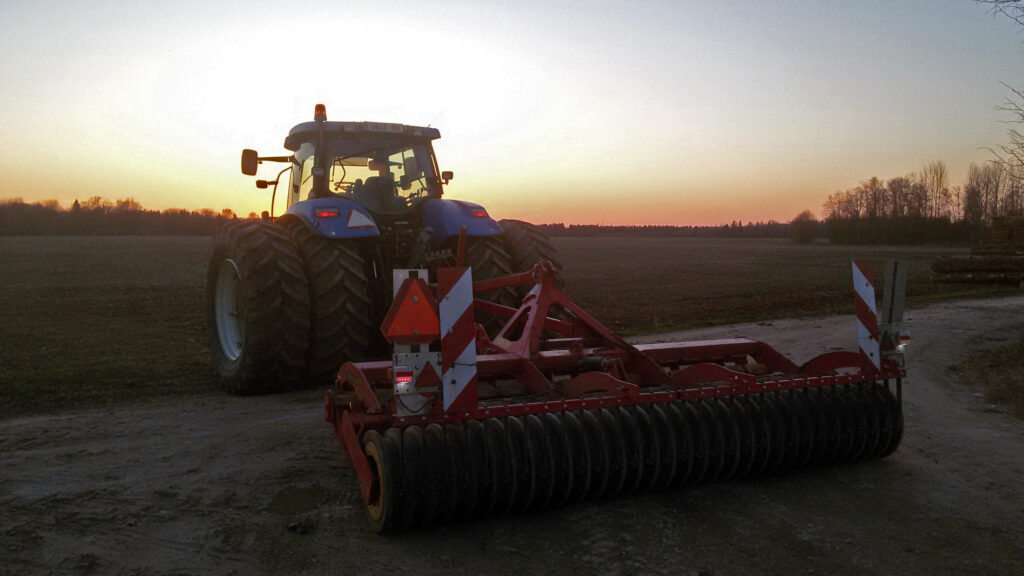
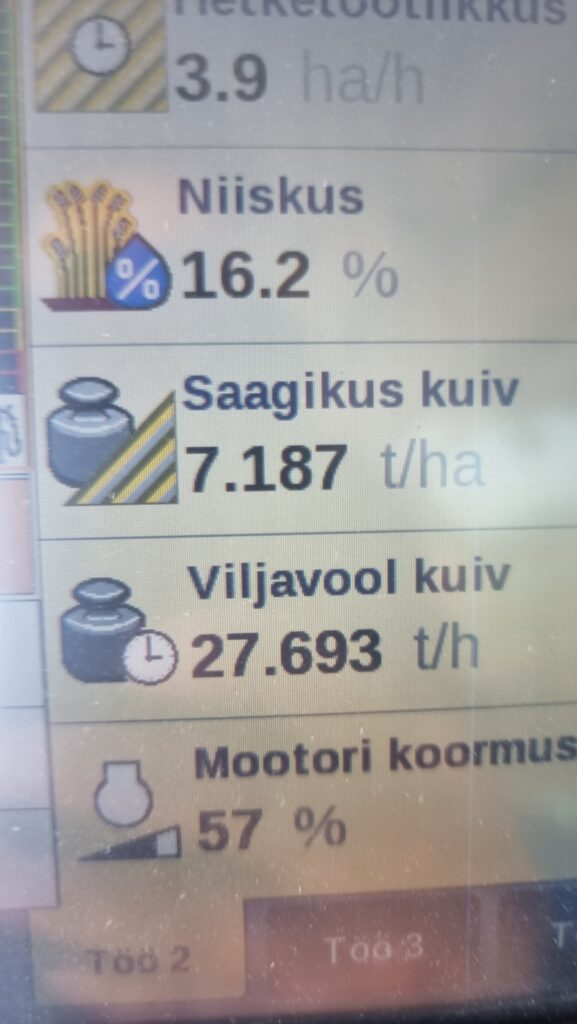
- Combine harvester yield monitor: When properly calibrated alongside the moisture sensor, the data is fairly accurate, with a margin of error of about 5% over the years. I calibrate the monitor based on the weights recorded by buyers.
- Grain sold to buyers: The yield calculation only includes the quantity I actually get paid for—moisture, impurities, and other losses are deducted.
- Farm-saved seed accounting: Autumn sowing seeds are weighed during the fungicide treatment process. Spring sowing seed quantities are estimated visually based on the volume in the storage bin. Over the years, my visual estimates have become accurate, with a margin of error around -5 to +5 tons—negligible considering the total yield is around 1,000 tons. 😄
Considering these factors, I can confidently say that going forward, if not pure gold, at least silver can be expected! 😊
Season 23/24
The long autumn of 2023 led to a significant growth of crops, especially rapeseed, raising concerns about winter survival early on. The year 2024 began with a week of -29°C temperatures, while my fields were covered with only 2–3 cm of snow. Warm and cold spells alternated, resulting in large ponds forming on the fields.
At the start of spring work, it was clear that winter rapeseed and winter barley had survived, while winter wheat had been affected by the “lakes” but was still in relatively satisfactory condition. Around May 9th, we experienced a frost with temperatures dropping to -8°C, followed by a month-long drought. It was feared that the yield had been damaged, leading me to revise my fertilization plan. Nitrogen levels, which have never been particularly high in my fields, were further reduced.
Let’s take a closer look at the results, starting from the best-performing crops and moving to the worst.
Breakdown of Results
The data is presented as follows:
- Crop and area
- Variety
- Spring N (active ingredient, kg/ha)
- Yield (crop average, variability across fields)
- Variable costs: fertilizer, crop protection, seed, fuel
- Gross margin: (sale price × yield – fertilizer, crop protection, seed, fuel)
- Comments
Winter Wheat – 88 ha, 8 fields (4 ha hybrid, 84 ha line variety)
- Variety: “Informer” (farm-saved seed), “Hyacinth” (purchased seed)
- Spring N: Line variety 86–152 kg/ha, hybrid 76–79 kg/ha
- Yield: 5.7 t/ha
- Variability: 4.2–6.4 t/ha
- Cost: €570/ha
- Gross margin: +€537/ha
- Comment: Winter wheat turned out to be the most profitable crop. Surprising? Not really, although I expected oats and peas to come closer. I achieved solid results this year with low nitrogen inputs. Interestingly, the hybrid wheat yielded 6.3 t/ha with just 76 kg of nitrogen per hectare—promising potential!
Winter Barley – 18 ha, 2 fields
- Variety: “Wallace” (farm-saved seed)
- Spring N: 91–94 kg/ha
- Yield: 5.56 t/ha
- Variability: 5.31–5.65 t/ha
- Cost: €467/ha
- Gross margin: +€394/ha
- Comment: Considering that many farmers lost their winter barley crops completely, I’m satisfied with the results. There was plenty of biomass, but the grains were not as dense as I would have liked due to the heat period. Test weight was around 620 g/l.
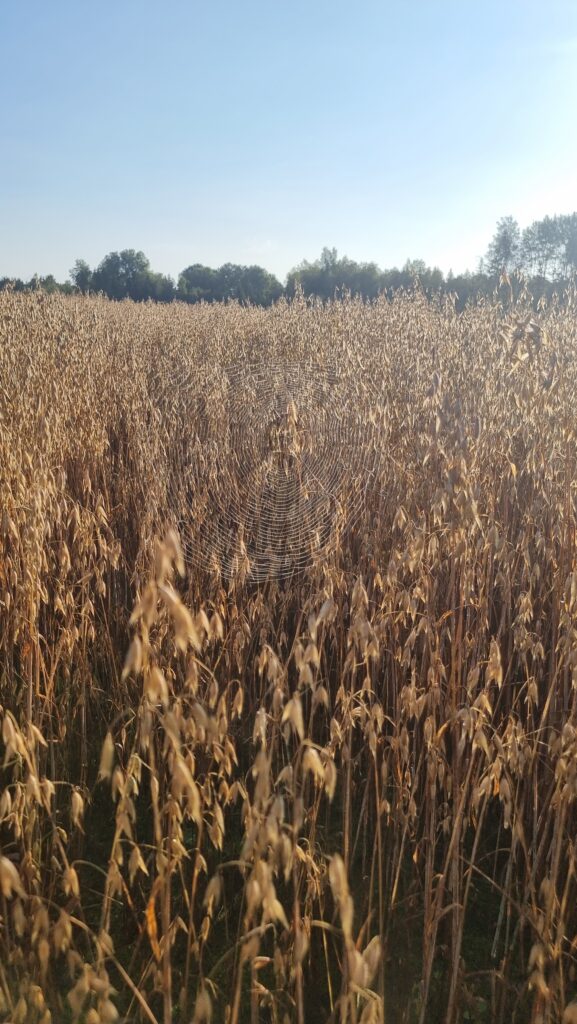
Oats – 37 ha, 2 fields
- Variety: “Symphony” (purchased seed)
- Spring N: 82–91 kg/ha
- Yield: 4 t/ha
- Variability: 3.8–4.1 t/ha
- Cost: €350/ha
- Gross margin: +€468/ha
- Comment: A new crop for me. Since oat prices were (and still are) good, I decided to plant oats instead of barley on some fields—and it was the right decision. Achieving food-grade oat quality was a bit challenging, but thanks to a neighbor’s drying setup, I managed to bring the test weight above 540 g/l, saving my profit. I’ll definitely grow oats again in 2025!
Field Peas – 55 ha, 3 fields
- Variety: “Symfony” (farm-saved seed)
- Spring N: 0–31 kg/ha
- Yield: 3 t/ha
- Variability: None
- Cost: €283/ha
- Gross margin: +€459/ha
- Comment: I conducted an experiment. One field received no fertilizer, just a single herbicide and insecticide application. Another field was heavily treated with fertilizer, multiple insecticides, fungicides, and micronutrients. The result? Both fields yielded exactly the same—3 t/ha. Conclusion: Since peas tend to lodge anyway, there’s no point in overinvesting.
Winter Rapeseed – 40 ha, 5 fields
- Varieties: “Akilah,” “Annabella” (purchased seed)
- Spring N: 83–112 kg/ha
- Yield: 1.6 t/ha
- Variability: 0.9–1.9 t/ha
- Cost: €680/ha
- Gross margin: -€14/ha
- Comment: Same story as winter barley—glad it survived. No significant winter damage. “Akilah,” sown on August 12, performed slightly better than “Annabella,” sown on August 4. Mistakes on my part, combined with unfavorable weather, led to this result. Thankfully, I didn’t overdo it with nitrogen. I’ll aim to do better in 2025.
Spring Barley – 19 ha, 2 fields
- Varieties: “Feedway,” “Eversti” (purchased seed)
- Spring N: 89–90 kg/ha
- Yield: 0.6 t/ha
- Variability: 0.4–0.8 t/ha
- Cost: €418/ha
- Gross margin: -€330/ha
- Comment: A complete disaster. Drought and aphids destroyed the crop, and the plants’ tillers failed to produce any harvestable grain. The purchased seed significantly increased losses. Hopefully, this marks the end of my spring barley cultivation.
Summary
Does the money earned per hectare seem good? However, this calculation only considers part of the income-expense equation. When you add property taxes, leasing payments, loans, repair costs, wages, drying and transportation costs, and other fixed expenses, the profit figures become significantly smaller, and losses grow larger. Since financial details vary greatly between producers, it’s best for each to calculate their own situation individually.
This type of calculation allows other producers to compare whether they are more efficient or less efficient than me in using their inputs.
Additionally, a lot depends on the price at which the crop is sold. For instance, winter wheat sold in August could have reduced the margin per hectare by more than €100.
Am I efficient enough in managing variable costs? Probably not – there’s always room for savings. Based on the feedback I receive from writing these posts, I also try to improve my own efficiency.